The selection, organisation and presentation of data in a form that is of optimum value to the intended user.
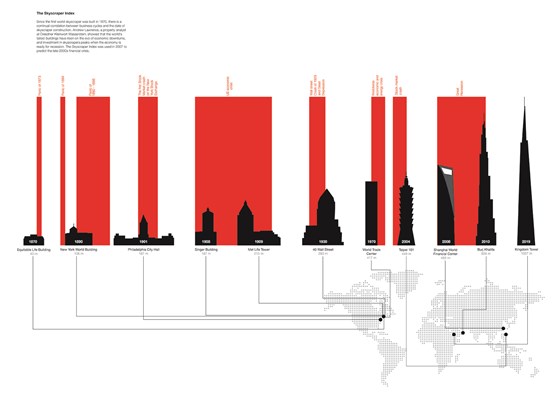
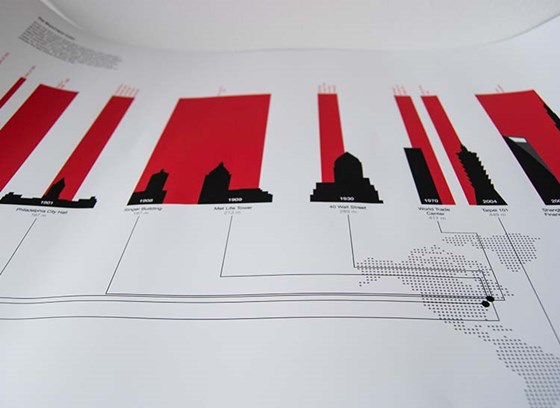
This solution is a visual representation of 'Skyscraper Index', which is a statistical correlation between business cycles and the date of skyscraper construction. Andrew Lawrence, a property analyst at Dresdner Kleinwort Wasserstein, showed that the world's tallest buildings have risen on the eve of economic downturns, and investment in skyscrapers peak when the economy is ready for recession. During the development of this proposal, I also stressed the fact that the location of skyscrapers shifted dramatically in the early 2000.
Comments: 0
There are no comments yet, be the first to write a comment!